By Dr Felipe M. de Andrade for GCRF-African SWIFT
Demands for accurate sub-seasonal forecasts with intervals from weeks to months into the future are increasing across Africa. Such forecasts in particular may support decision makers to take preparedness actions for preventing or reducing the impacts of severe weather conditions on lives, properties and economic activities. The need to issue skilful sub-seasonal forecasts is therefore crucial for improving livelihoods in Africa.
However, for sub-seasonal forecasts to be successfully interpreted and communicated, it is necessary to examine their quality. This is traditionally done by comparing forecasts against observational data using a set of forecast verification metrics. Since the sub-seasonal timescale looks at weeks to months into the future, evaluating the quality of deterministic and probabilistic forecasts is suitable for driving improvements in model development and operational use.
Furthermore, assessing the quality of forecasts linked to potential sources of sub-seasonal predictability, such as the Madden-Julian Oscillation, El Niño-Southern Oscillation and Indian Ocean Dipole, would lead to better understanding what drives sub-seasonal precipitation predictability in Africa, allowing to increase confidence on forecasts.
Performing these forecast quality assessments is a particular task of the Global Challenges Research Fund African Science for Weather Information and Forecasting Techniques (African SWIFT) project, which specifically aims to build research capability and improve forecast verification practices within African operational weather services.
To this end, researchers at the Universities of Reading and Bristol developed an unprecedented sub-seasonal forecast verification framework for African precipitation. This was done by evaluating hindcasts (i.e., forecasts produced for a period in the past using the current model configuration) from three operational forecasting systems (the European Centre for Medium-Range Weather Forecasts, the UK Met Office, and the National Centers for Environmental Prediction) and investigating associations between specific sources of predictability and the quality of forecasts.
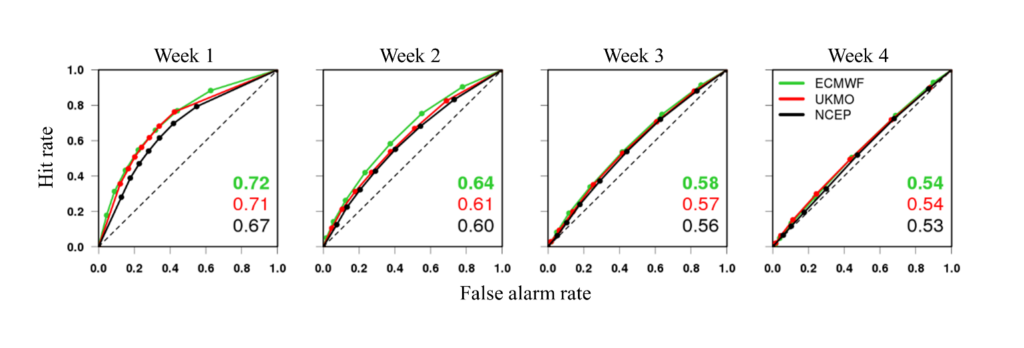
To illustrate how far in advance sub-seasonal precipitation forecasts may provide useful and actionable information to forecasters and decision-makers in Africa, for example, the Pearson’s correlation coefficient and relative operating characteristic diagrams are displayed in Figures 1 and 2, respectively. The former is a common metric employed to assess the degree of association between forecasts and observations without implying causation, whilst the latter evaluates the ability of forecasts to predict binary outcomes (e.g., rain or no rain events) considering a set of probability thresholds.
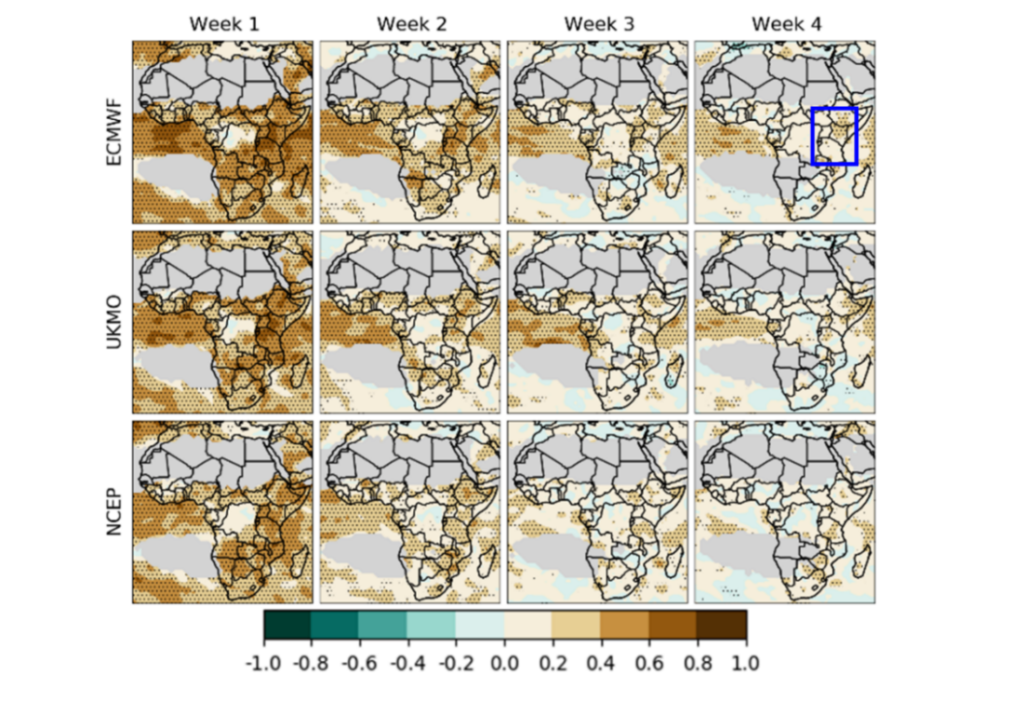
Results have shown valuable deterministic skill for the first two weeks of forecasts over most African regions (Figure 1). Although forecast quality has sharply reduced in subsequent weeks, it is still indicating some encouraging skill up to three weeks ahead as also seen in the probabilistic evaluation for East Africa (Figure 2). This could be used to trigger preparatory action in the decision-making process and to validate the issuance of extreme weather early warnings, for instance.
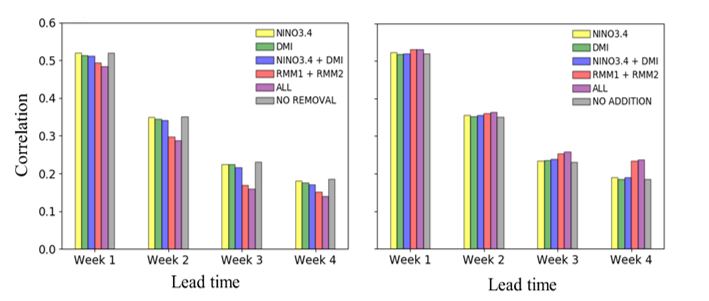
The study also shows that sub-seasonal precipitation forecast skill in Africa is related to the major tropical climate drivers (Figure 3). The research highlights that these drivers are important sources of sub-seasonal predictability, leading to significant skill improvements. Thus, improving the representation of well-known drivers of climate variability and their impacts on precipitation within forecasting systems may result in better sub-seasonal predictions for Africa.
Sub-seasonal forecast verification products have been developed within the GCRF-African SWIFT project to assist forecast users when evaluating the skill of real-time forecasts. Future work will also include different calibration techniques to provide more reliable forecasts.
Paper Information
de Andrade, F. M., Young, M. P., MacLeod, D., Hirons, L. C., Woolnough, S. J., & Black, E. 2021. Subseasonal precipitation prediction for Africa: Forecast evaluation and sources of predictability. Weather and Forecasting, 36(1), 265-284. https://doi.org/10.1175/WAF-D-20-0054.1
About the Author
Dr Felipe M de Andrade is a research scientist at the National Centre for Atmospheric Science/University of Reading (NCAS/UoR) where he has been developing research on sub-seasonal forecast verification for Africa to provide support to forecasters and decision-makers in different sectors of society.
Before joining NCAS, Dr Andrade completed a PhD degree in meteorology at the National Institute for Space Research (INPE) in Brazil and contributed to improving understanding of sub-seasonal forecast skill when working on the CLIMAX (Climate Services Through Knowledge Co-Production: A Euro-South American Initiative for Strengthening Societal Adaptation Response to Extreme Events) project.